Research funders who use the researchfish platform set regular submission dates to collate and evaluate the outputs and outcomes of the research that they fund. This helps them understand their funding portfolio and plan future strategy. All funders set their own submission dates but a large proportion of them have chosen to collate data annually during the first quarter of each year.
While submissions made during the first quarter of the year do not include all of the research community that uses researchfish, the variety of funders represented and the volume of data their submission period produces provides us with a good overview. Furthermore, the 2021 submission statistics offer an initial snapshot of how the pandemic has impacted the research environment. Individual funders can now drill down into their submission data to understand more about the evolution of their projects and programmes over the pandemic period and use this information to support their research objectives going forward.
All disciplines have experienced disruption to research activities. In some areas people have been diverted to different or COVID related work. Many researchers and their loved ones will have contracted the virus. Many projects have been put on hold or stopped. Some people are unable to access usual research facilities such as laboratories either because other work has taken precedence or because they are now working from home. Many researchers, especially those with caring responsibilities, have been particularly affected in their research capacity. All of these issues and others will have had an impact on the research submissions this year.
To put the Q1 2021 submission statistics into context we have looked at the variations in submission data from 2016 to 2021 and noted any similarities and differences from previous reporting patterns. Although we can summarise trends and suggest potential reasons for them, the data that we have presented here does not aim to analyse motivations or situations. An additional subset of questions relating to COVID-19 has been included by some funders in this and subsequent submission periods but this subset of questions is not included in this blog post.
Gavin Reddick, Chief Data Analyst at researchfish by Interfolio presented the data covered in this blog in a recent webinar and a recording can be viewed on-demand. See full presentation
How does the number of awards submitted in 2021 compare to previous years?
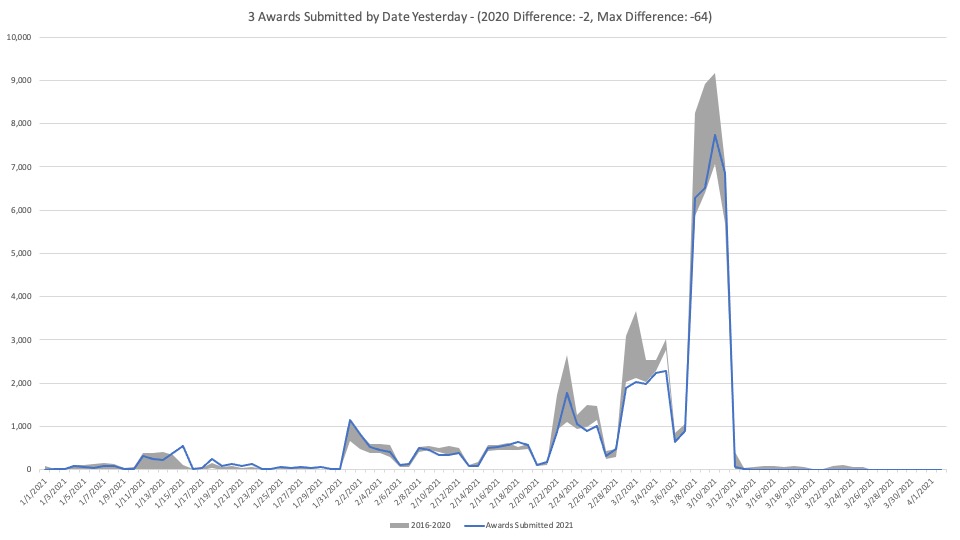
The grey shaded area in this illustration shows the minimum and maximum number of awards submitted on corresponding dates between 2016 and 2020. (Note: the dates have been time shifted to match weekdays/weekends etc). The blue line represents the awards submitted in the 2021 submission period.
The initial surge on this illustration in January represents the end of the submission period for many Danish funders and the growing number of submissions throughout February culminating in March, which represents the multi-funder submission period in the UK.
At first glance we can see that the general pattern is very similar and researcher behaviour is fairly predictable. However, while there was a high degree of commonality with the number of awards submitted throughout Q1 2021 the total tended to be towards the lower end of the number from previous submissions periods (although not always the lowest number recorded). In fact, the number of awards submitted has been increasing steadily each year since 2016 until it dropped by approximately 13% from 2020 to 2021. However, the number of awards submitted in 2021 is still above levels recorded in 2016 and 2017.
Which awards have been affected most?
In researchfish awards are typically reported on throughout the duration of the award and for a number of years after the award has finished. This provides useful information to understand the time taken from outputs to impact.
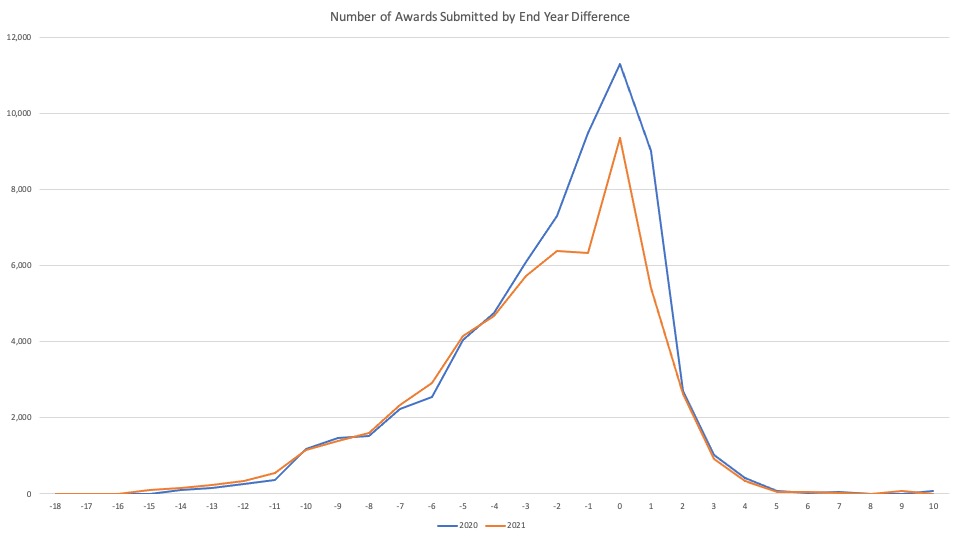
This next illustration shows the number of awards where information was submitted (y-axis) in relation to the year that an award is due to finish (x-axis). Therefore, on the x-axis the 0 refers to awards that finished in 2020, -1 awards that finished in 2019, +1 awards due to finish in 2021 and so on. The blue line represents data submitted in 2020 and the orange line data submitted in 2021.
For awards that finished 4+ years prior to the actual submission period there is only a small variation in the amount of awards that are still reporting outputs, outcomes and impact between the 2020 and 2021 figures. Similarly, for awards that are due to finish 2+ years from the actual submission period the pattern for reporting is relatively unchanged. The biggest difference in reporting data is in relation to awards that were due to finish one year prior to the actual submission period and those that are due to finish 1-2 years from the actual submission period. In other words the reduction of reporting primarily relates to awards that are very recent, have recently ended or will soon end.
Does the award type have a correlation with the number of awards submitted?
As already mentioned the number of awards submitted in 2021 is approximately 13% lower than 2020 figures. Is this reduction experienced across all awards or are some disproportionately affected?
If we consider the percentage difference in relation to overall submission figures between 2020 and 2021 we get a clearer picture of which types of awards have been most affected.
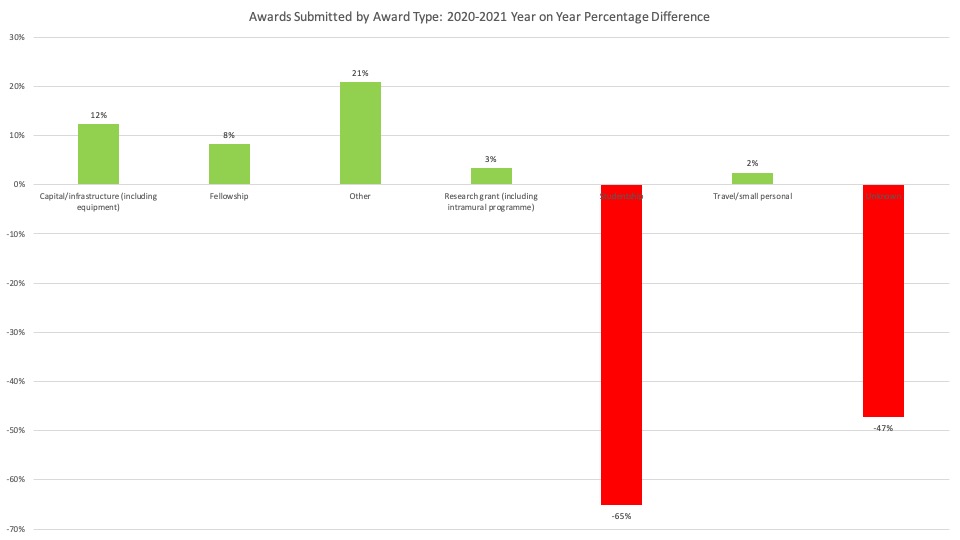
The chart below shows the percentage change in seven different award types; capital/infrastructure, fellowship, research grant (including intramural programme), studentships, travel/small personal, other and unknown.
The most striking change is the reduction in the proportion of studentships which has reduced by 65%. One possible explanation for this is that many recipients of studentships were not required to submit in 2021.
(Note on the chart below. The reduction in “unknown” is because selecting the award type in the researchfish platform is a new field. Therefore as principal investigators confirm what type of award they are reporting on the number of unknowns is reduced)
How has the number and proportion of reported outputs and outcomes changed?
The number of awards reported and the number of outcomes reported in 2021 have both reduced in comparison to 2020. However, the number of awards has reduced by a greater amount (-13%) compared to the number of outputs and outcomes (-10%). It is worth mentioning that a 10% drop in outputs and outcomes is not unprecedented (this was also seen between 2017 and 2018).
This means that there has been a higher average number of outputs reported per award in 2021 than in 2020. This fits the data from a previous illustration (number of awards submitted by end year difference) which showed that the awards most likely not to report in 2021 were those that had just started, i.e. those would have not yet have accumulated a large number of outputs.
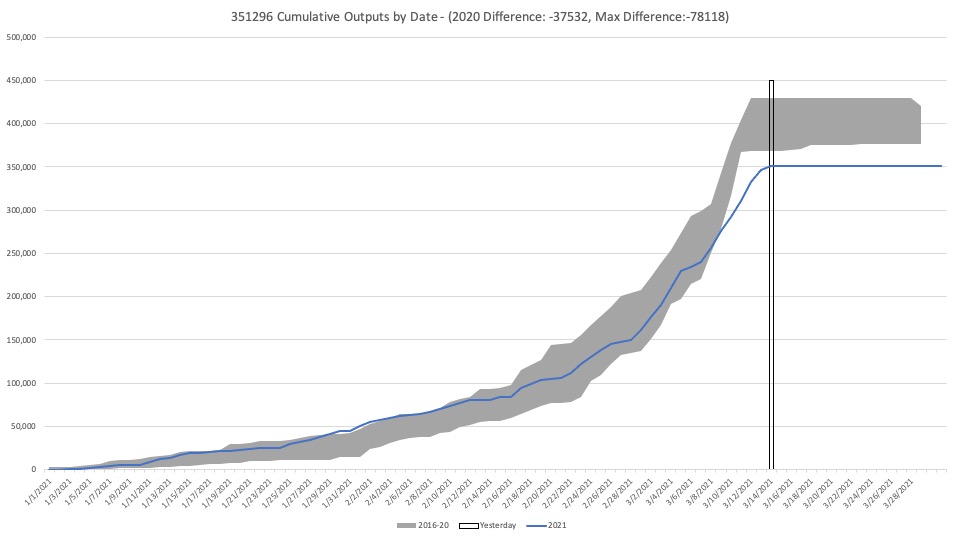
The end of the UK multi-funder submission period always sees a spike of activity and 2021 was no different. The number of outputs reported increased steadily throughout the submission period with a large number of outputs reported during the final couple of weeks. However, this is where the difference between previous years is most evident. The grey shaded area in the illustration below shows the upper and lower cumulative levels of outputs between 2016 and 2020 and the blue line represents the data for 2021. From January to the beginning of March the 2021 blue line representing the number of outputs submitted fits within the cumulative spread but from March onwards the gap becomes more obvious.
There are many reasons why the number of outputs and outcomes has decreased. We can reasonably assume that some researchers were suffering from or shielding from coronavirus, others would have been unable to access research facilities and others would have had work diverted or stopped. Clearly, some output pathways would have been more viable during the pandemic than others and examining the difference in outputs by section can provide a clearer picture.
Difference in common outputs reported by section
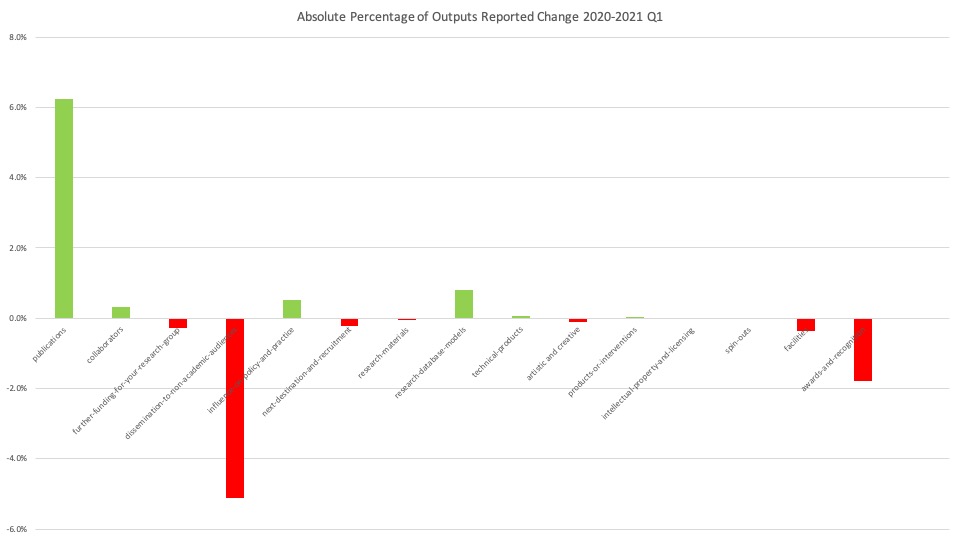
This chart depicts the absolute percentage change of outputs by common section from 2020 to 2021.
Unsurprisingly desk-based activities have seen an absolute increase with publications increasing by a little over 6 %, research databases and models at almost 1% and smaller increases in influence on policy and practice, collaborators and technical products.
The biggest reduction is seen in the dissemination to non-academic audiences (by 5%), awards and recognition (almost 2%), facilities, further funding for research grants, next destination and recruitment and artistic and creative. These results are logical due to social distancing and the reduction in open days and events.
However, the picture comes into a slightly different relief when we look at the relative percentage change of the reported outputs between 2020 and 2021.
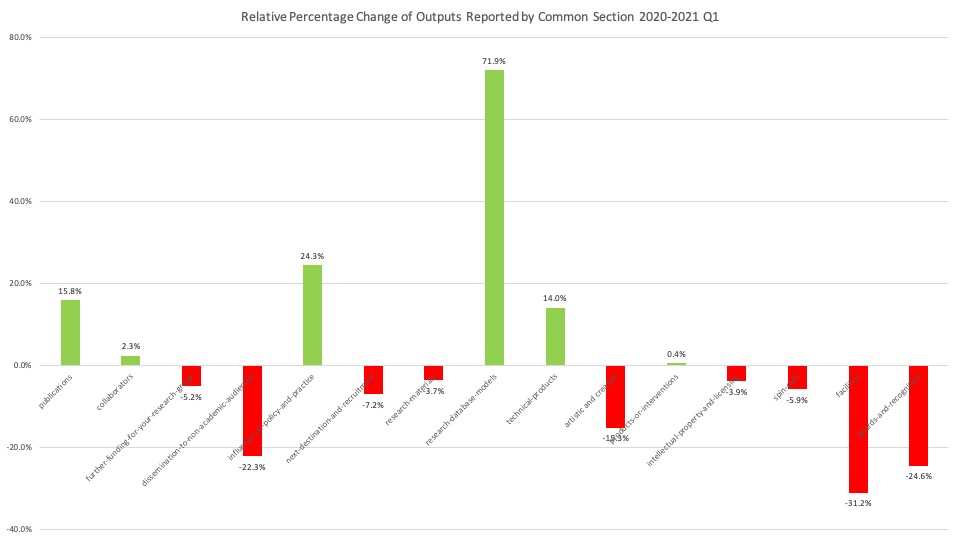
The relative increase of research database models, influence on policy and practice, publications and technical products is very striking. The causes are likely to be many. This year researchfish has benefited from greater integration with Datacite and has increased its ability to harvest information. Some of these increases can be attributed to the new harvesting methods. Also these areas of increase are not as reliant on physical access to facilities. It will be interesting to understand whether the relative changes to these outputs is because of the pandemic or in order to combat the pandemic. For instance, is the 24% increase in influence on policy and practice related to COVID-19?
Publications
Publications made up just under half of the reported outcomes in the 2021 Q1 submission period. This percentage has been dropping over the last 5 years from 53% of all reported outputs in 2016 to 39% in 2020. (The drop in other outputs during the pandemic has meant that the percentage of outcomes reported as publications has increased to 46% for the 2021 submission period).
However the increase in publications in 2021 is likely due to a variety of factors; not only what kind of outputs are more viable during the pandemic but also significant changes to the researchfish platform that make reporting easier for the principal investigator.
Researchfish is working to increase integration between systems and improve data harvesting in order to reduce the burden on researchers with an “input once” philosophy for data. This year’s Q1 submission statistics show considerable progress has been made.
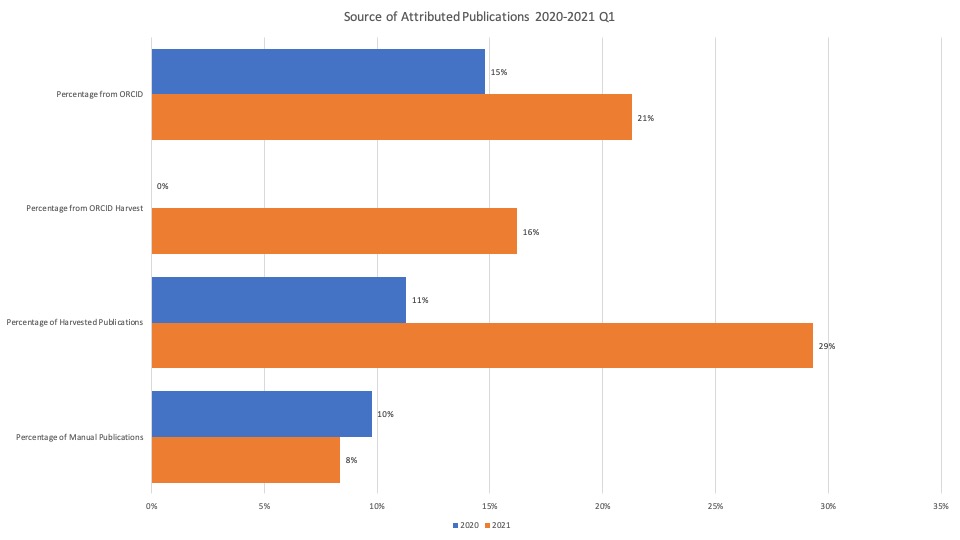
Researchfish uses a variety of ways to gather information about publications that relate to funded awards. Researchers can link information sources such as their ORCID accounts and select which publications to attribute to certain awards or input publication data manually. Researchfish also automatically harvests data from a range of sources. The percentage of harvested publications has increased considerably from 11% in 2020 to 29% in 2021.
Changes to data collection and how this might affect future submission periods
Researchfish has been working on an initiative to help researchers report further funding. To make this process easier a database of 2,000,000 grants from 270 countries has been created.
Researchers can look up their funding body and select their grants. They do not have to add any further information. If their grant details are not listed they can find their funder and add the grant details manually. This initiative was introduced halfway through the 2019 submission period. Initially 80% of principal investigators who used this function to find their funding had no further information to input and just 20% were required to fill out further information relating to the grant. If the principal investigator was required to enter information manually the platform generated an action for the researchfish development team to add this new funder or grant details to the database.
Currently 25% of further funding information is allocated to submissions by using this database reducing the amount of input required from researchers. Due to continuing improvements now only 10% of those that use the database function are required to input any further information. Further integrations and look-up facilities are being developed to facilitate the submission process for all parties.
The data obtained from the Q1 2021 submission period has provided an important initial insight into how research activities have changed since the outbreak of the pandemic. Further study is needed, particularly using data from the Q1 2022 and future submissions, to identify whether changes are short or long term and to enable funders to use this information to help shape future funding strategies.
If you already use researchfish but would like to learn how to delve deeper into your data and use it to help shape future strategy please contact our Customer Team who will be happy to advise on the variety of options available, including consultancy services for specific projects.
If you are not yet a researchfish organisation but would like to learn more about how the platform can help you capture and evaluate the whole range of outputs and outcomes of the research that your organisation funds, please complete your details below.